LLM Ops
Published on:
Khursheed Hassan, Founder & CEO Cloudidr

Recently, a publicly traded healthcare company we work with found that LLM API costs within a single engineering department had grown from low thousands to over $200,000 in a matter of months. The cause was not rogue usage — it was mandated. Leadership had directed many dozens of engineers to adopt AI coding tools as part of a company-wide productivity initiative.
What was missing was any mechanism to track, attribute, or govern the cost as it scaled. By the time finance became aware, the overage had already happened. It is, increasingly, the pattern — and it is precisely the problem that AI FinOps as a discipline is emerging to solve.
The rapid growth of the large language model market provides important context. OpenAI and Anthropic — the two providers whose models sit at the centre of most enterprise AI deployments (along with Gemini) — have seen their yearly revenue trajectories grow at a pace rarely observed in enterprise software. That growth is, in large part, a direct reflection of what companies are spending on AI API costs.
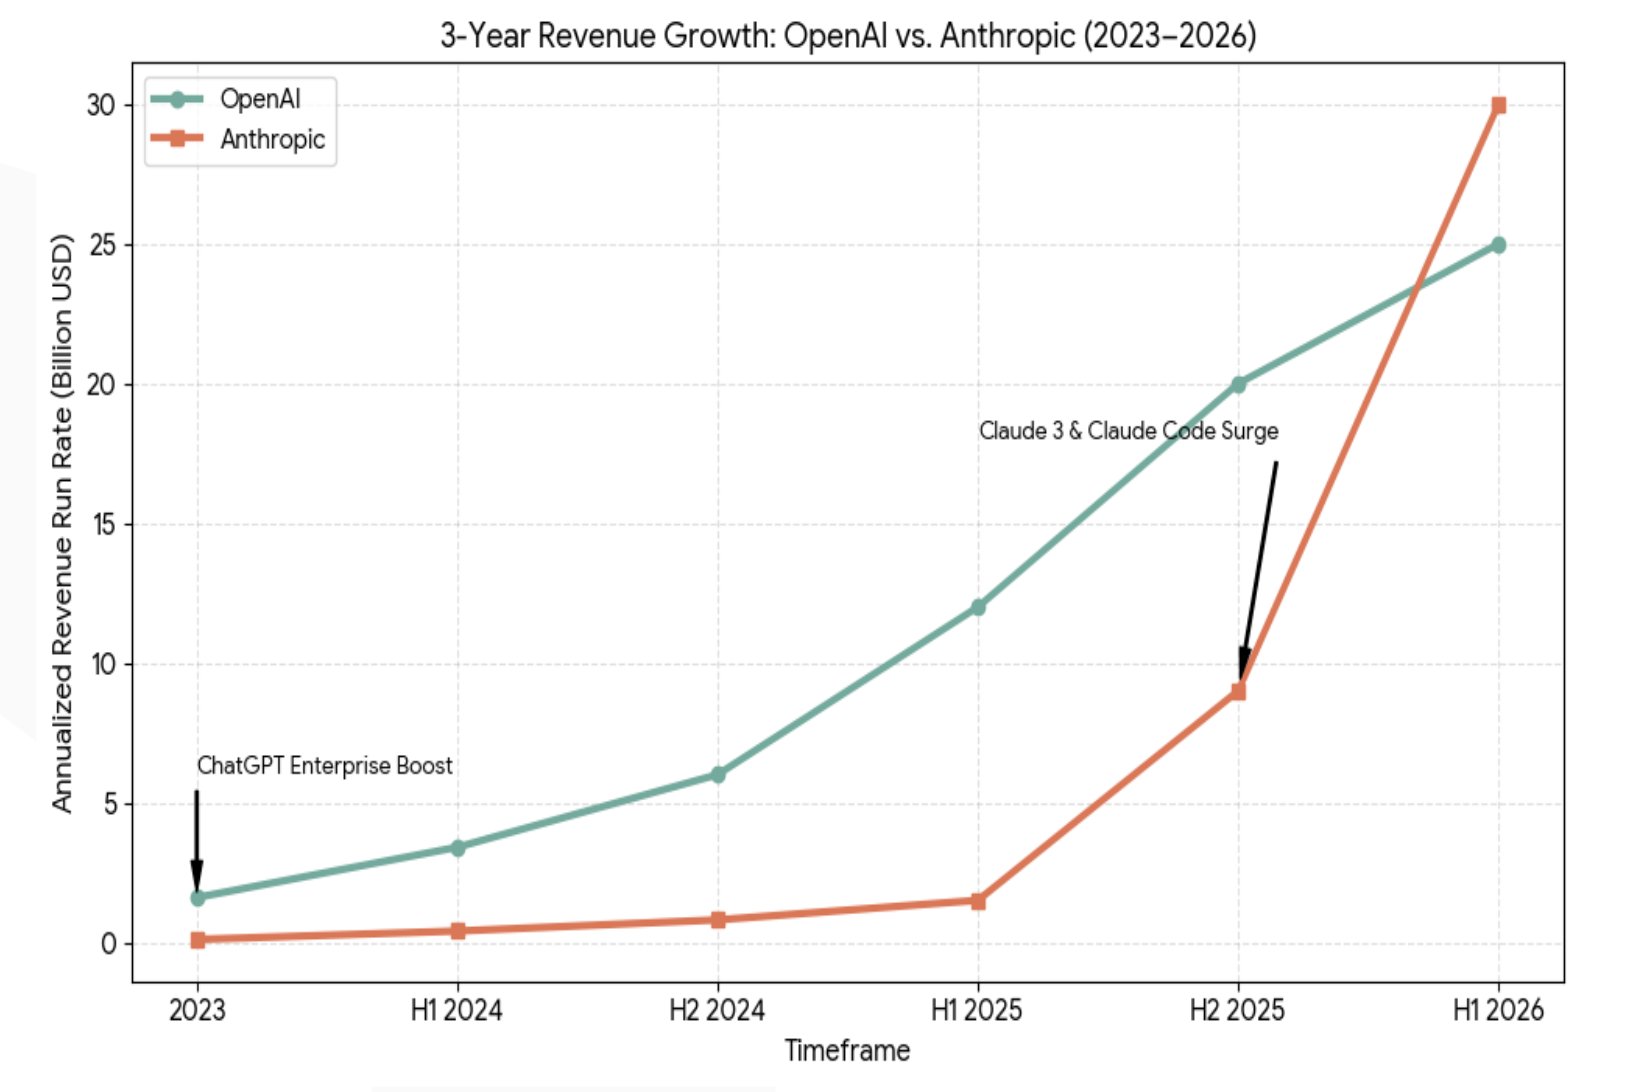
Figure 1. Three-year annualized revenue run rate for OpenAI and Anthropic, 2023–H1 2026. The acceleration in Anthropic's trajectory from H2 2025 reflects the rapid enterprise adoption of Claude 3 and Claude Code. Source: public earnings disclosures and analyst estimates, compiled by Cloudidr Research, 2026.
What the chart above illustrates — is spending that is not just concentrated in a handful of companies. It is distributed across thousands of businesses, flowing through engineering departments, product teams, sales automation tools, and customer-facing agents. The CFO's challenge is not to stop this investment. It is to understand and govern it with the same rigor applied to any other material line item.
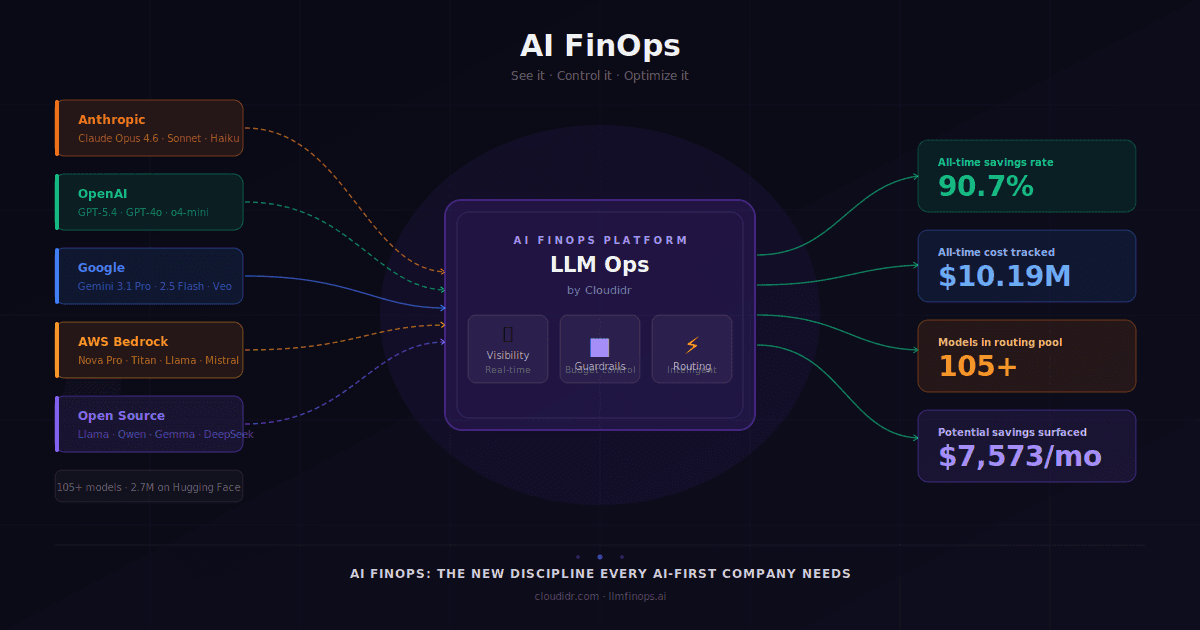
In this article, I explore how a purpose-built AI FinOps platform changes that dynamic: giving finance and engineering leaders shared visibility into LLM API costs, the ability to investigate attribution at granular depth, and the governance mechanisms to act before costs become surprises.
An Executive View of AI Spend
The starting point for any CFO engaging with AI costs is a clear, consolidated view of spend — not a spreadsheet assembled from engineering tickets, but a live financial dashboard. Year-to-date position against budget. Month-to-date variance. Projected annual run rate based on current consumption trends. These are familiar constructs; what is new is applying them to LLM API expenditure in real time.
The dashboard below illustrates what this looks like in practice. The organization has spent $87,240 year-to-date against an annual budget of $80,000 — a modest overage that, without real-time visibility, would typically surface only at quarter close. The month-to-date figure of $16,240 against a $15,000 monthly allocation tells a more immediate story: spending is running slightly ahead of plan, and the finance team has both the data and the time to respond thoughtfully and engage with the relevant teams.
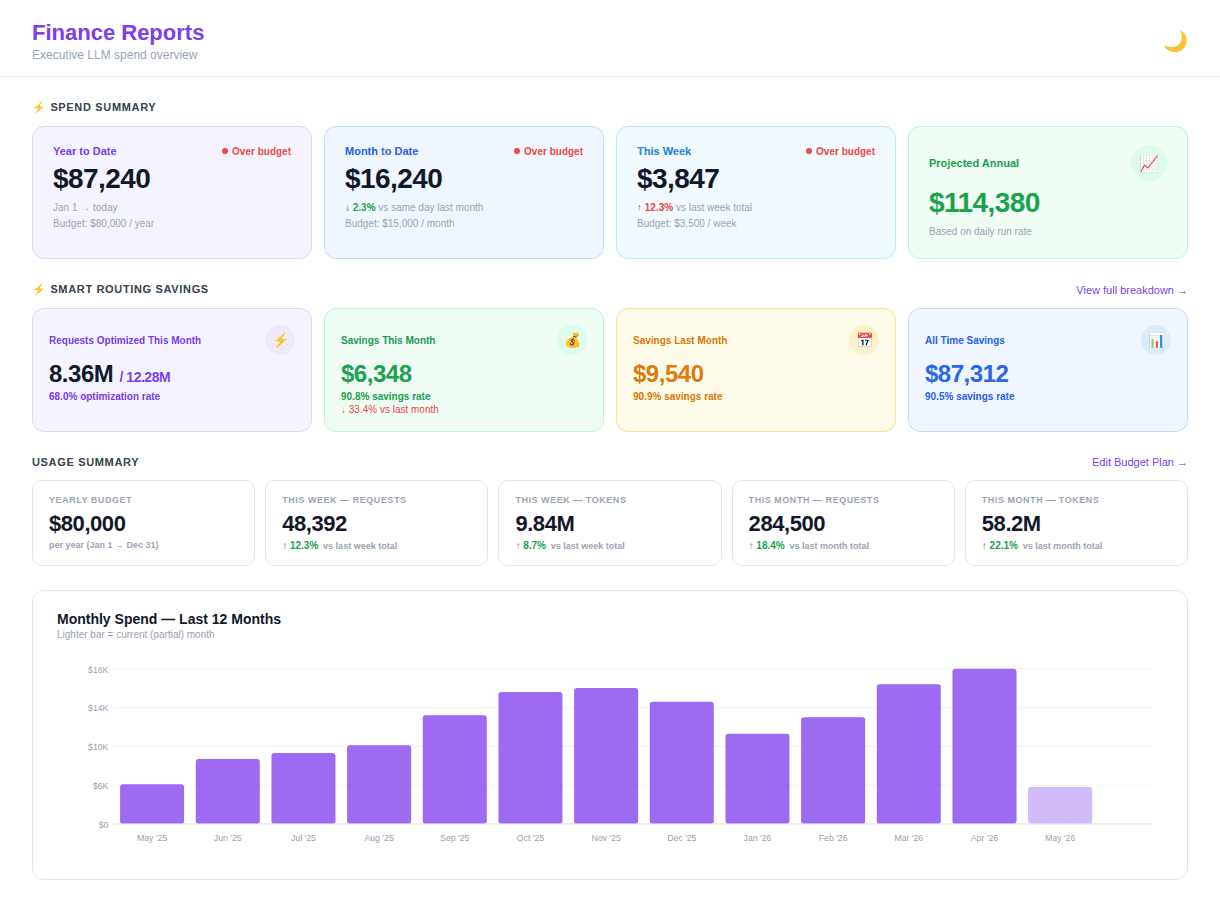
Figure 2. Executive Finance Dashboard (Cloudidr LLM Ops Platform) — year-to-date spend position, smart routing savings, usage summary, and 12-month trend. The savings section shows $6,348 recovered this month through intelligent model routing, partially offsetting the budget variance.
Equally important is what the dashboard communicates about efficiency. The smart routing savings section shows that $6,348 was recovered this month through automatic model routing — requests directed to less expensive capable models without any change to application code. That figure is not merely a cost reduction; it is evidence that AI spend can be actively managed, not simply observed after the fact.
For CFOs who prefer to receive a structured report rather than navigate a new tool, this data can be delivered automatically as a weekly digest each Monday morning — covering spend, savings, budget status, and the most significant week-over-week movements by department and project, arriving in the inbox alongside other finance correspondence.
The question is no longer whether AI will appear in the P&L. It is whether finance will understand it when it does — and whether that understanding arrives in time to act.
Understanding Spend Across the Organization
Aggregate spend tells only part of the story. The more important question for finance leadership is attribution: which departments are driving LLM API costs, which AI providers are being used, and whether the distribution of expenditure reflects the organization's strategic priorities.
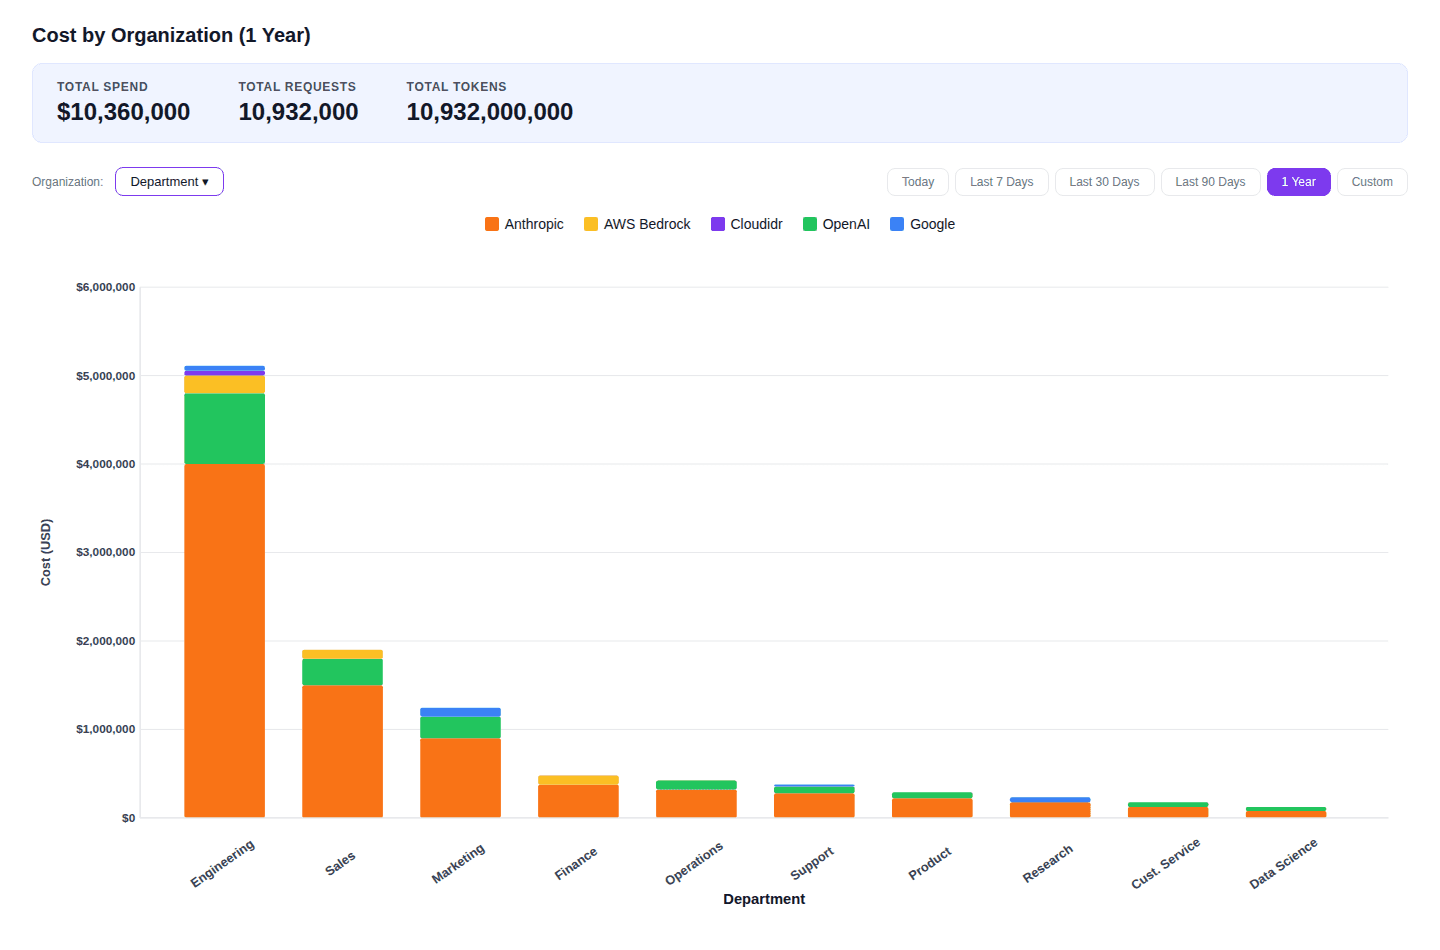
Figure 3. Cost by Organisation, 1 Year (Cloudidr LLM Ops Platform) — The provider stack within each bar shows the mix of Anthropic, OpenAI, AWS Bedrock, and Google across departments.
In the example above, Engineering accounts for roughly half of total annual AI spend at $5.1M, with Sales and Marketing following at $1.9M and $1.25M respectively. Finance, Operations, and Support each represent meaningful but more contained expenditure. This distribution is not inherently problematic — high Engineering spend may reflect entirely legitimate infrastructure investment in AI-assisted development and production systems running agents. What matters is whether the CFO and engineering leadership can engage in an informed conversation about it, grounded in data rather than approximation.
The provider breakdown within each bar adds a further dimension. Where multiple providers appear within a single department, finance and technology leaders can examine whether the mix reflects deliberate routing strategy — selecting the most cost-effective model for each class of task — or whether it represents uncoordinated tool adoption that may be carrying unnecessary cost. This is precisely the kind of conversation that provider-level attribution makes possible
Drilling Into Token-Level Attribution
For organizations deploying agentic AI at scale, the most valuable capability may be the ability to trace expenditure to its source — not just to a department, but to a specific project, agent, and token type. Text tokens carry one cost profile; image generation, audio transcription, and video processing carry quite different profiles. Understanding which modalities are driving spend is essential both for cost governance and for honest return on investment analysis.
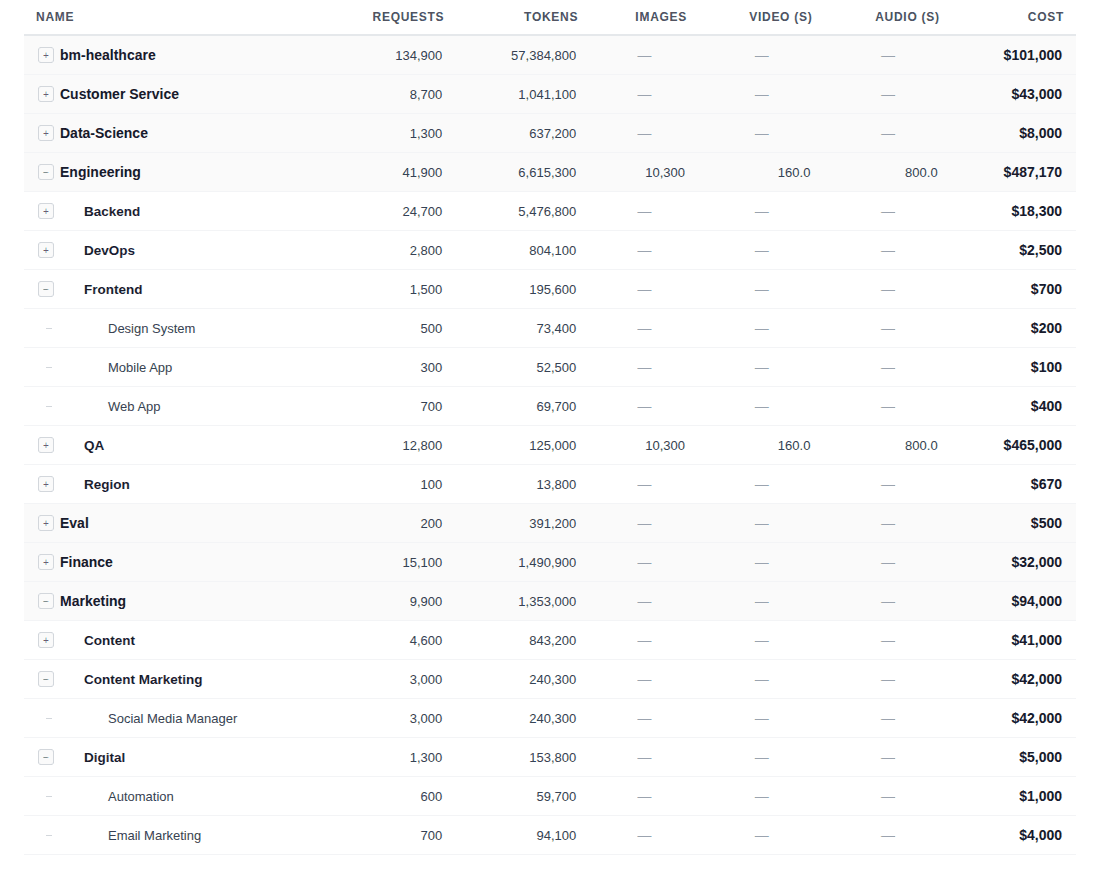
Figure 4. Hierarchical cost breakdown by department, project, and agent (Cloudidr LLM Ops Platform) — including token-type attribution across text, images, video, and audio.
The table above illustrates this in practice. Within the Engineering department, the QA project accounts for $465,000 of the total — substantially more than Backend ($18,300) or DevOps ($2,500). An examination of the token breakdown reveals that this cost is driven largely by image, video, and audio processing: 10,300 images, 160 seconds of video, and 800 seconds of audio in the period reviewed. Whether that investment is justified depends on what QA is producing and the value it delivers — but the data creates the conditions for that conversation to take place with precision.
This is where AI FinOps intersects with return on investment analysis (ROI) at a project level. A CFO reviewing the Marketing department's $94,000 in annual LLM spend can examine whether the Content Marketing agent's output is generating measurable value commensurate with its cost, and whether the Digital team's email automation is performing at the efficiency suggested by its token consumption. Without token-level attribution, these questions are difficult to pose with any precision. With it, they become part of ordinary financial governance.
On Anomaly Detection
Unusual patterns in token type distribution — a sudden increase in audio or image processing within a department that does not ordinarily use those modalities — can indicate either a new legitimate use case or an agent operating outside its intended scope. Real-time attribution makes both possibilities visible before they become financial events.
Preemptive Governance: Budget Guardrails in Practice
Visibility alone does not constitute governance. The critical complement to financial reporting is the ability to enforce limits — to ensure that when an agent or project approaches its budget, the organisation is alerted in time to respond thoughtfully, and that when a limit is reached, expenditure is automatically contained rather than allowed to accumulate until the next billing cycle.
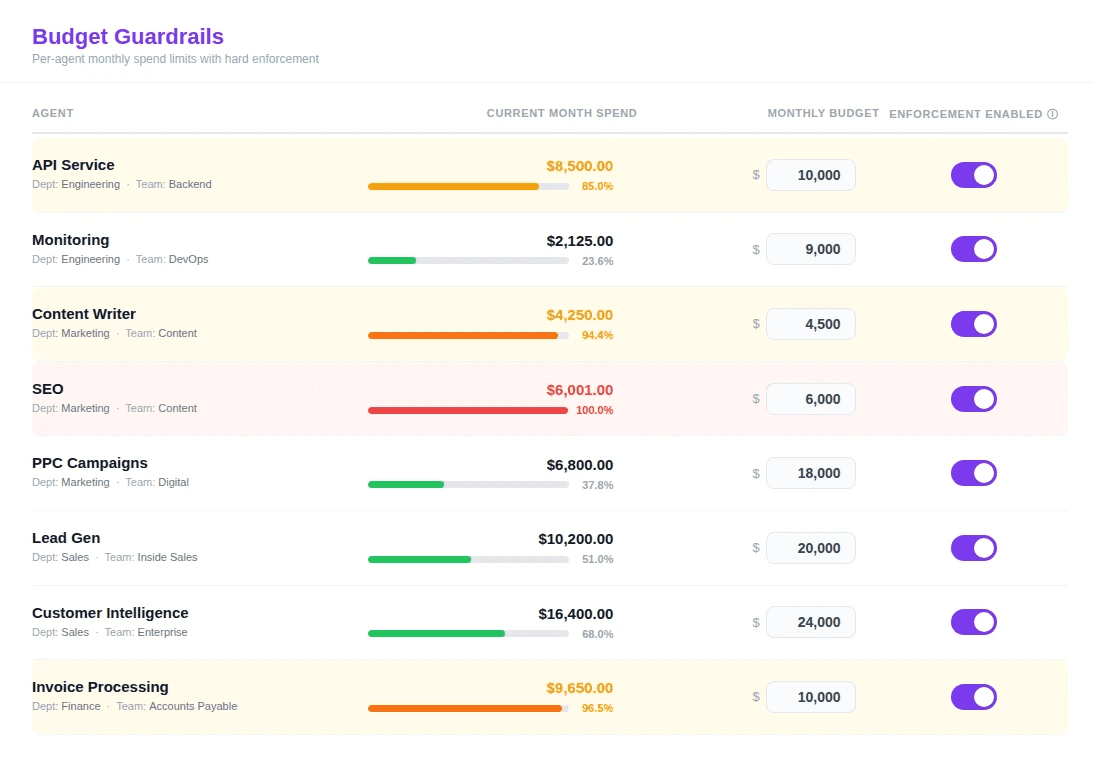
Figure 5. Budget Guardrails (Cloudidr LLM Ops Platform) — per-agent monthly spend limits with real-time progress tracking.
The guardrail interface above shows eight agents across Engineering, Marketing, Sales, and Finance, each with a defined monthly budget and a current spend position. Two observations merit particular attention. The SEO agent has reached its $6,000 monthly limit — spend is shown in red at $6,001 and has been automatically blocked, preventing further accumulation. The mechanism worked precisely as intended: the limit was enforced at the moment it was reached, not discovered weeks later in a consolidated invoice. Again the responsible party can take action and decide to increase the cap upon reviewing the status.
The Content Writer agent, at 94.4% of its $4,500 budget, sits within the advisory alert threshold — the point at which the platform notifies both the engineering owner and the finance team, providing time for a considered decision: whether to adjust the budget, constrain the agent's scope for the remainder of the month, or simply confirm that the expenditure is within acceptable tolerance.
The Invoice Processing agent in Finance, at 96.5% of its $10,000 budget, illustrates a common and legitimate pattern. Month-end finance processes are inherently token-intensive; the agent may well require additional capacity in the final days of the period. With real-time visibility, that conversation can take place on a Tuesday rather than in the post-mortem of a budget review six weeks later.
Closing Thoughts
The emergence of AI FinOps as a discipline reflects a broader maturation in how organizations relate to artificial intelligence. The exploratory phase — in which AI costs were broadly tolerated as the price of innovation — is giving way to a more considered model in which AI expenditure is expected to be accountable, attributable, and proportionate to the value it generates.
For CFOs and finance teams, the tools now exist to engage with AI spend on their own terms: through familiar financial constructs of budgets, variances, and projections, supplemented by the granular attribution that token-level data makes possible. The organizations that develop this capability early will be better positioned not only to control costs, but to direct AI investment toward the projects and agents that demonstrably earn their place in the budget.
That, ultimately, is what financial governance has always been about — ensuring that resources flow toward their highest-value use. AI FinOps extends that discipline into a domain that is growing faster than any technology budget line in recent memory, and where the cost of inattention compounds every month.